

AI visual recognition has advanced rapidly over the past two years. Today's AI can recognize faces, vehicles, and products, and can even understand emotions and scenes in images. But when it comes to industrial sorting, food inspection, agricultural breeding, and drug identification, it often fails.

For example:
Two equally transparent bottles—one PET and one PVC—may look to an ordinary camera like nothing more than “plastic bottles”;
Both are white powders—one is sugar, the other salt—and an RGB image can hardly tell them apart;
Fruits that are equally red may differ completely in ripeness, sugar content, and internal damage;
Materials that look identical can differ vastly in composition, moisture content, and purity.
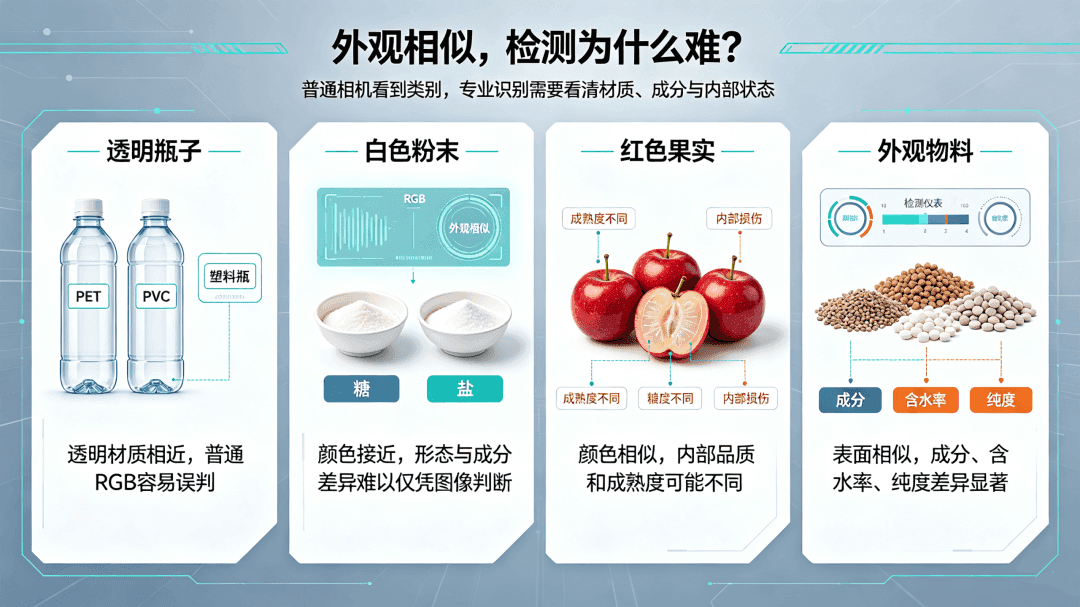
The problem isn't that AI isn't smart enough; it's that it sees too little information. It's not that the algorithms aren't powerful enough, but that the sensing dimensions are too limited. Most vision AI uses RGB images, which have only three bands: red, green, and blue. Three bands are enough to describe what something looks like, but not enough to answer what material it is.
This article sets out to make one thing clear: for AI object recognition to be truly reliable, it needs to add perception at the “material layer.” Hyperspectral spectral fingerprints are the key to building that foundational understanding.
01 The fundamental bottleneck of RGB: information is already lost during imaging
An ordinary RGB camera mimics the human eye's response, compressing the spectral information entering the lens into three channels: red, green, and blue. Its imaging process can be approximated as follows:
Camera channel response = light source spectrum × object reflectance spectrum × camera quantum efficiency
This means that RGB does not see the full spectrum; instead, it sees three results produced by integrating and compressing the spectrum.
This process introduces several common issues:
Metamerism
Two materials can have different spectral curves but may produce similar RGB values under a specific light source and camera response. For example, different plastics, dyes, and food additives can appear nearly identical in RGB images.
Coupling of light source and object information
Color depends not only on the object itself but also on lighting conditions, camera white balance, and capture geometry. A model may learn illumination changes rather than material differences.
Highly similar scenes lack discriminative information.
When targets are very similar in shape, color, and texture, the cues for telling them apart often come from chemical bonds, water content, ripeness, oxidation level, or surface scattering properties. Most of this information is not present in the RGB channels.
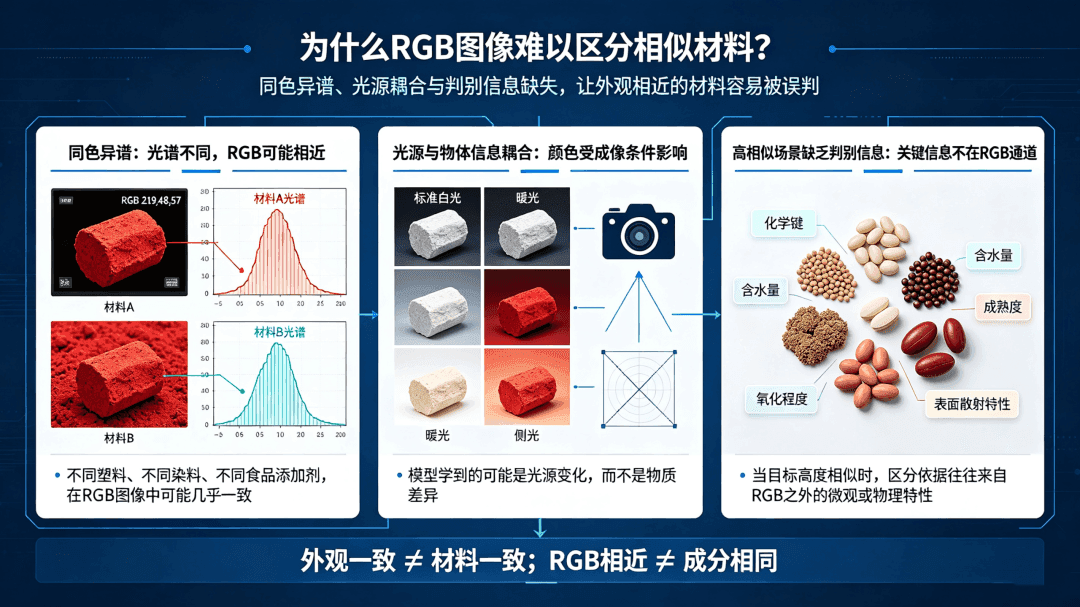
So RGB vision excels at semantic recognition—for example, “this is a bottle, an apple, or a circuit board”—but it does not inherently provide material-level discrimination. For tasks such as industrial sorting, food inspection, and drug identification, RGB alone often hits an information-theoretic ceiling.
02 Hyperspectral imaging turns images into “spatial × spectral” data cubes
So how can hyperspectral imaging achieve this? It comes down to how matter interacts with light.
When light strikes the surface of a material, some of it is absorbed and some is reflected. Physical and chemical processes such as molecular bond vibrations and electron energy-level transitions cause different materials to absorb and reflect light at different wavelengths to varying degrees. Plotting the relationship of “reflectance versus wavelength” as a curve produces the material’s reflectance spectrum.
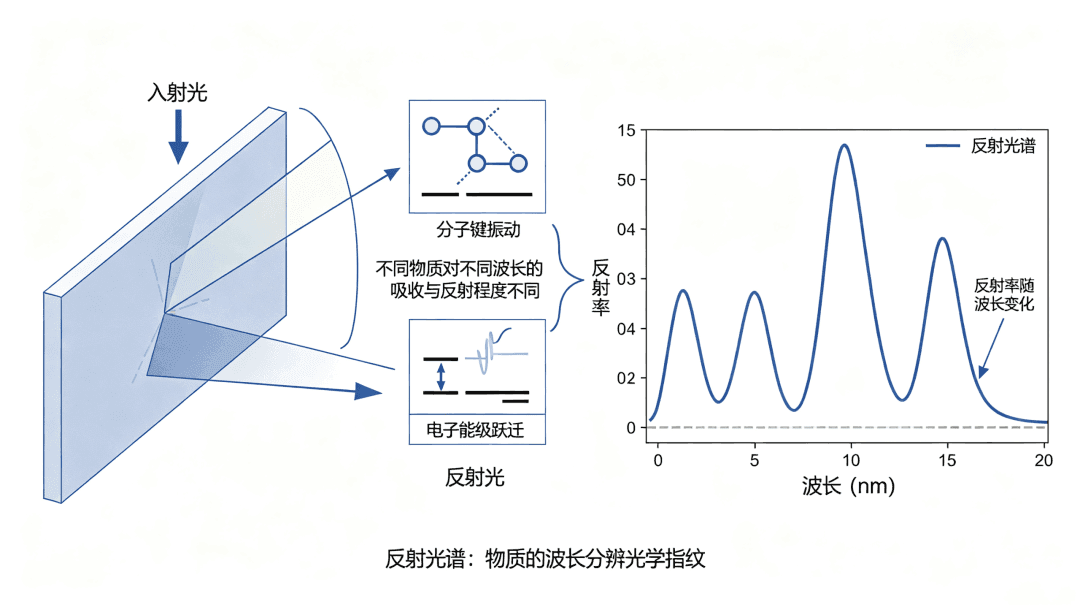
It is not the same as color. Color is only the human eye's rough perception of three bands of visible light; hyperspectral imaging records continuous spectral bands from visible light through near-infrared and shortwave infrared, typically covering 400 to 2500 nanometers and containing dozens to hundreds of narrow bands. The industry summarizes this as “different materials, different spectra; the same material, the same spectrum.”
Hyperspectral imaging has another characteristic: it unites imaging and spectroscopy. The sensor records not only spectra but also spatial position, forming a data cube of "two spatial dimensions plus one spectral dimension." Every pixel in the image carries a complete spectral curve, and this is what makes "pixel-by-pixel material identification" possible.
The core of hyperspectral imaging is adding a continuous wavelength dimension to two-dimensional spatial imaging.
An ordinary image can be represented as I(x, y, 3).
A hyperspectral image, in turn, forms a data cube I(x, y, λ).
Among them:
x and y represent spatial coordinates;
λ denotes wavelength;
Each pixel no longer has only three values; it is a spectral vector with tens to hundreds of dimensions;
Common spectral bands include VNIR at approximately 400–1000 nm, NIR at approximately 900–1700 nm, and SWIR at approximately 1000–2500 nm;
Spectral resolution typically ranges from a few nanometers to several tens of nanometers, depending on the sensor design.
After radiometric calibration, the sensor's raw radiance can be converted to reflectance:
Reflectance = (target radiance − dark current reference) / (white panel reference − dark current reference)
Each pixel can then be represented as a set of continuous spectral curves. Different materials produce distinct spectral responses because of differences in electronic transitions, molecular vibrational overtones and combination bands, and scattering and absorption mechanisms.
Strictly speaking, a hyperspectral reflectance spectrum is not exactly equivalent to the molecular "fingerprint region" in infrared or Raman spectroscopy, because it is also affected by chemical composition, particle size, surface roughness, water content, observation geometry, and instrument response. However, for a given spectral range, set of measurement conditions, and modeling objective, it can serve as a high-dimensional, statistically analyzable, and learnable fingerprint of material characteristics.
That is exactly the foundation of hyperspectral AI.
To give “spectral reading” a reliable basis, the field has built standard spectral libraries. For example, the USGS spectral library from the U.S. Geological Survey contains more than 3,400 reference spectra for minerals, rocks, soils, vegetation, and man-made materials, using “standard fingerprints” measured under laboratory conditions to compare unknown samples.
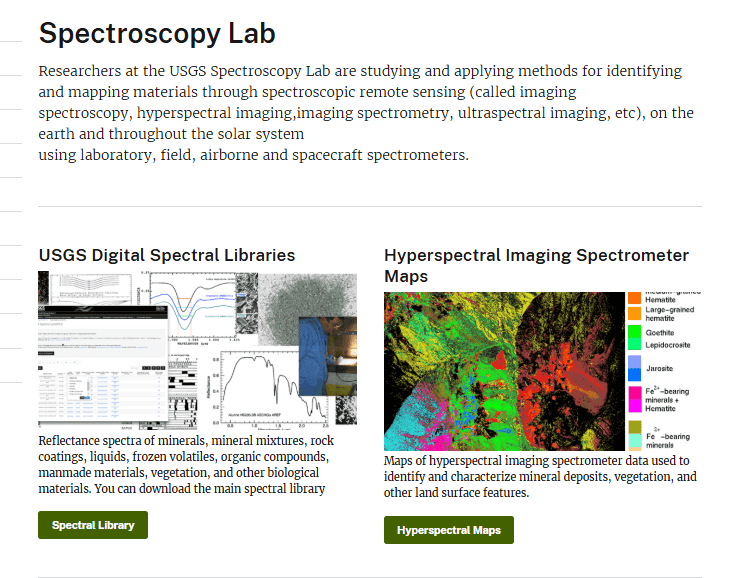
Figure 1: Spectral fingerprint curves of different substances (schematic)
03 From “seeing images” to “reading spectra”: how hyperspectral imaging and AI work
With spectral fingerprints, the identification pipeline becomes: an imaging spectrometer collects data; after radiometric calibration and correction, per-pixel spectral curves are extracted and either matched against a spectral library or fed into a deep learning model, ultimately producing a material identification result.
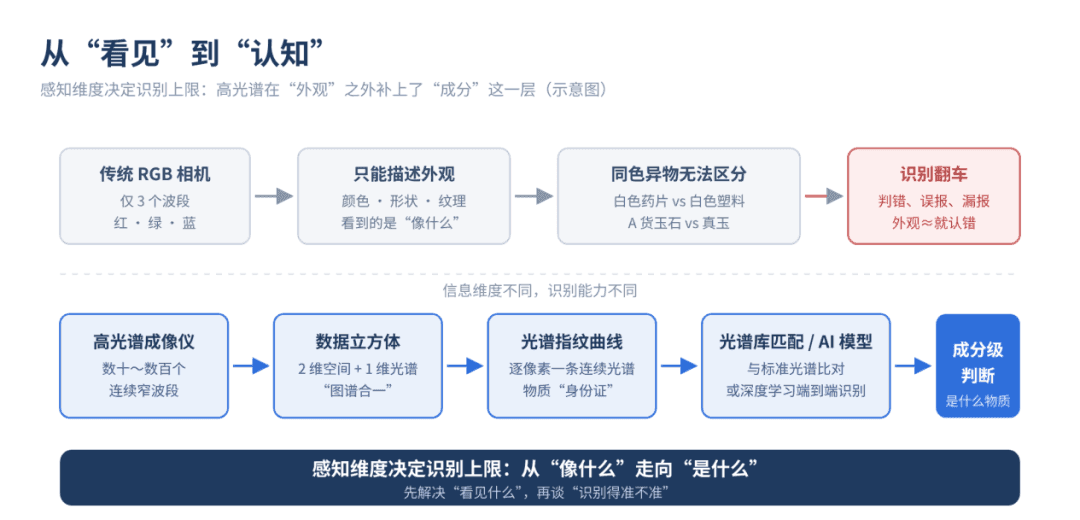
Figure 2: Comparison of RGB and hyperspectral recognition pipelines (schematic)
Spectral library matching works more like looking something up in a dictionary: it compares an unknown spectrum with standard curves in a library—for example, through least-squares curve fitting—to find the closest entry. This approach is interpretable and traceable, and it is the mainstream method for classic applications such as mineral mapping.
The deep learning approach is data-driven: models such as convolutional neural networks and Transformers directly learn joint spectral–spatial features and automatically perform feature extraction and classification. Hyperspectral data often has hundreds of dimensions and also contains interference such as mixed pixels and environmental noise. Traditional algorithms struggle to handle this, while deep models excel at learning robust patterns in high-dimensional data.
It is worth noting that deep learning does not replace spectral libraries; the two are more complementary: spectral libraries provide physical priors and interpretable anchors, while deep models provide stronger feature representation. Interpretability is becoming a key term in this field—identification results must be able to explain “why” before regulatory and engineering settings can confidently adopt them.
Implementation cases already span multiple industries:
• Agriculture and food: hyperspectral testing detects and removes internal mold in peanut kernels; non-destructive freshness testing for cherries and blueberries achieves near-zero error; production-line solutions are also available for meat freshness and metal detection.
• Mining and geology: A classification model trained on the USGS spectral library can identify more than 100 minerals with noise resistance, supporting mineral exploration and mapping.
• Circular recycling: Deep learning enables pixel-level material classification of plastics, moving sorting from “by color” to “by material” and increasing the value of recyclables.
• Medical and biological: hyperspectral microscopy is used to identify and classify tiny particles such as microplastics; label-free tissue imaging is also being explored for lesion boundary assessment.
• Environment and remote sensing: airborne and spaceborne hyperspectral sensing is used for land cover classification, water quality monitoring, and cyanobacteria alerts, significantly improving survey efficiency.
04 How spectral fingerprints build a foundational understanding of matter
The essence of hyperspectral AI is not simply adding input channels, but establishing a mapping from spectral space to material properties.
It can handle three types of core tasks:
1. Classification: determining “what it is”
That is, dividing pixels or target regions into different categories, for example:
Plastic materials such as PET, PE, PP, PVC, and PS;
different minerals, agricultural product varieties, or pharmaceutical raw and auxiliary materials;
Normal tissue and diseased tissue;
Industrial materials of different quality grades.
The model form can be expressed as:
Category = f(spectral vector)
Common methods include SVM, random forest, partial least squares discriminant analysis, 1D-CNN, spectral Transformer, and hybrid models.
2. Quantitative inversion: determining “how much”
Hyperspectral data can not only classify but also perform regression to predict continuous variables, for example:
Sugar content, acidity, and moisture content of fruit;
Crop chlorophyll, nitrogen, and moisture content;
Food protein and fat content, and adulteration ratios;
Drug blend uniformity and active ingredient content.
The model form can be expressed as:
Attribute value = g(spectral vector)
These tasks usually require registration against measured physicochemical values to build a spectral–reference regression model. Common choices include PLSR, support vector regression, Gaussian process regression, and deep regression networks.
3. Spectral unmixing: determining what the mixture is composed of
In real-world scenes, a single pixel often contains multiple materials. In these cases, single-label classification alone is not enough; we also need to estimate the abundance of each component.
A linear mixed model can be expressed as:
Observed spectrum = Σ (endmember spectrum × abundance) + noise
Endmember extraction and abundance inversion allow analysis of mixture composition, blending ratios, and spatial distribution. This is especially important in mineral remote sensing, food adulteration, microplastic identification, and complex industrial material analysis.
Therefore, hyperspectral AI output is not limited to class labels; it can also include:
Material type, composition, state parameters, mixing ratio, spatial distribution, prediction confidence, and uncertainty. This brings it closer to an “imaging-capable online material analysis method.”
05 Trend: The next layer of AI object recognition is material perception
Traditional machine vision addresses “seeing” and “recognizing.” Hyperspectral AI must go further, addressing “distinguishing accurately” and “explaining clearly.”
It frees AI from relying solely on color, shape, and texture, enabling it to obtain material, composition, and state information through continuous spectra. It moves classification from semantic labels to material properties, and detection from outcome assessment to process inversion.
Future AI object recognition systems will not rely on a single sensor but on a multimodal perception architecture: RGB handles spatial semantics, hyperspectral imaging identifies material composition, thermal imaging captures temperature state, lidar or depth sensors capture geometric structure, and AI handles multi-source fusion and decision-making under uncertainty.
The significance of hyperspectral spectral fingerprints lies not in building a more complex camera, but in giving AI a missing physical dimension.
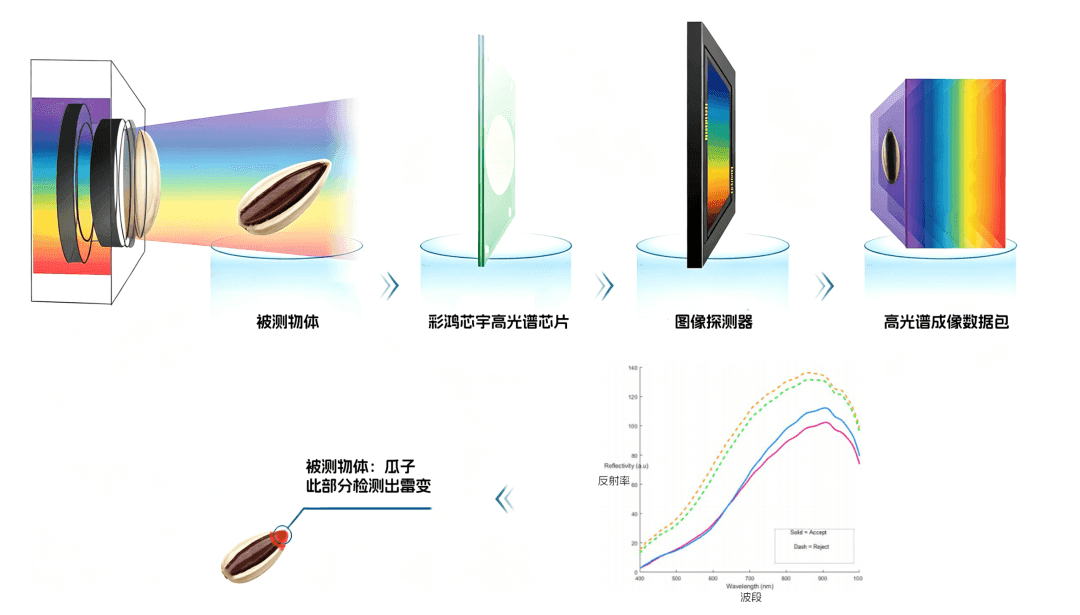
This dimension is moving from research papers to production lines. SPECU makes hyperspectral hardware significantly smaller, lower-cost, and more stable. Its self-developed miniaturized hyperspectral module can be mounted directly on food companies' existing high-speed production lines to perform nondestructive inline screening for internal mold and aflatoxin in nuts, and can extend to applications such as wafer defect inspection and ore inspection.
When machines can not only recognize objects but also understand what they are made of, what state they are in, and what changes have occurred, AI truly moves from “visual perception” to “material cognition.”