

Every beam of absorbed light tells a molecular story about matter.
Take a single nut—no need to shell or grind it, and no chemical reagents. One scan with a hyperspectral camera tells you its moisture content, level of oil oxidation, and whether it is contaminated with mold.
A single seed—no planting or germination test required. In just seconds, hyperspectral imaging can determine its vigor level, varietal purity, and whether it has become moldy.
Many people seeing this technology for the first time have the same reaction: How is that possible? With just one light scan, you can tell what chemical components are inside?
So how exactly does hyperspectral imaging use different wavelength bands of light to "see" the chemical composition inside a material?
01 What does hyperspectral actually measure?
To understand hyperspectral imaging, let’s start with the ordinary camera we know best.
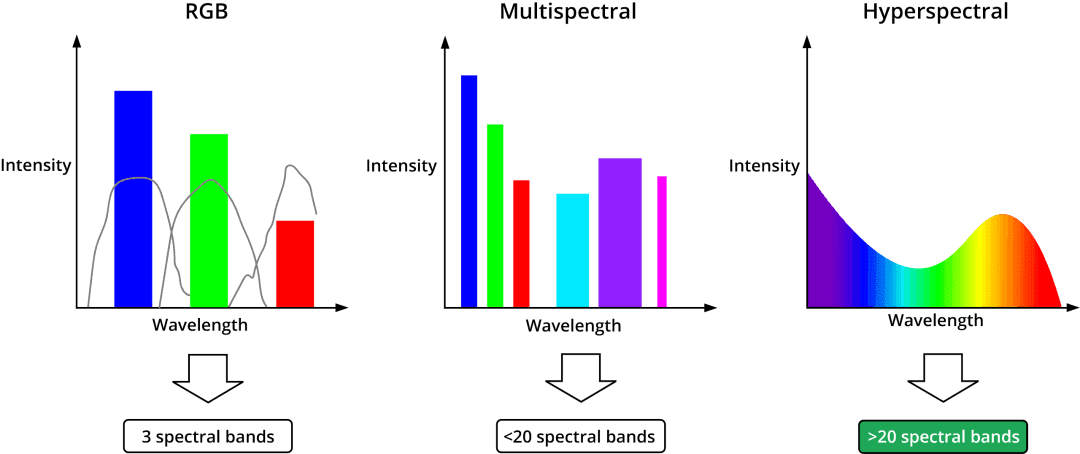
When a smartphone camera takes a photo, each pixel records only three values: the light intensity in three broad bands—red (R), green (G), and blue (B). This is equivalent to seeing only the "approximate color" of a material—very coarse information.
Hyperspectral cameras do something completely different: they divide the visible to near-infrared (and even mid-infrared) range into 100 to 300 contiguous narrow bands, each only 5 to 10 nanometers wide.
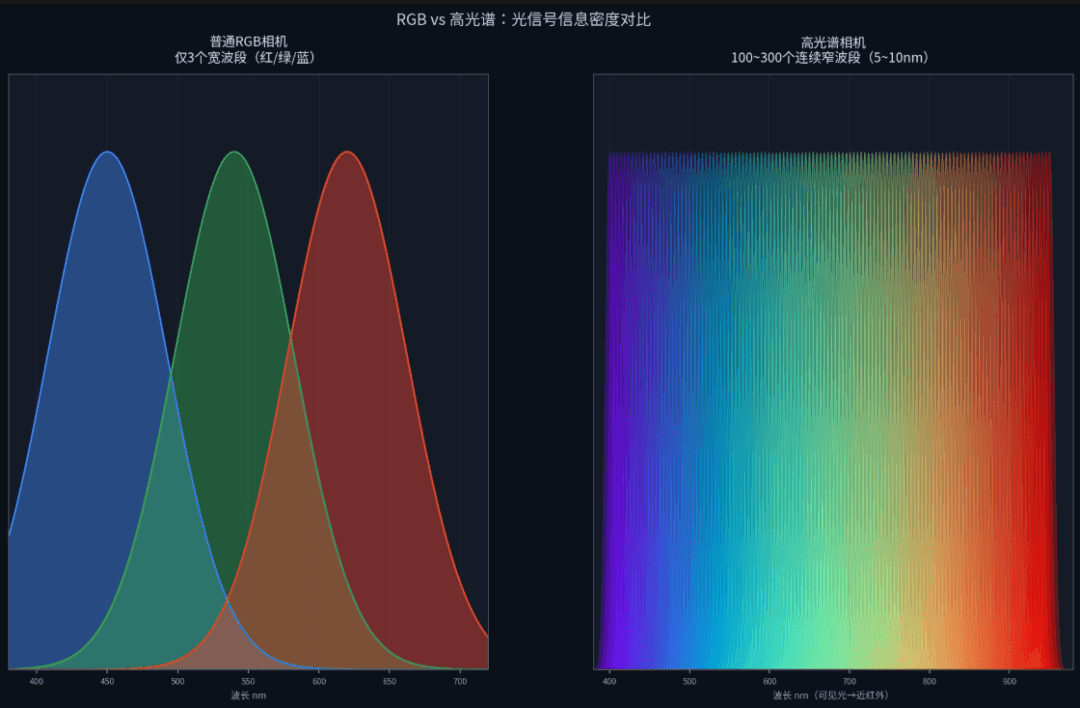
What does this mean?
This means a hyperspectral camera does not capture a "color photo" but a three-dimensional data cube: the first two dimensions are spatial position (the image), and the third is spectral wavelength. Each pixel corresponds to a complete "reflectance–wavelength" curve.
This curve is the material's "spectral fingerprint."
Moving from three color channels to hundreds of spectral channels is a leap of orders of magnitude in information.

Why is it called a "fingerprint"? Just as everyone's fingerprint is unique, different substances have different molecular structures, and so they absorb and reflect light of different wavelengths in different patterns. Once you have this curve, you can work backward to determine which molecules are present and in what amounts.
But this raises a question: why can light absorption patterns reflect chemical composition? What is the physical mechanism behind this?
02 Light–molecule interactions
Hyperspectral sensing can detect chemical composition, and the underlying logic is just one sentence: different molecular structures produce characteristic absorption at specific wavelengths.
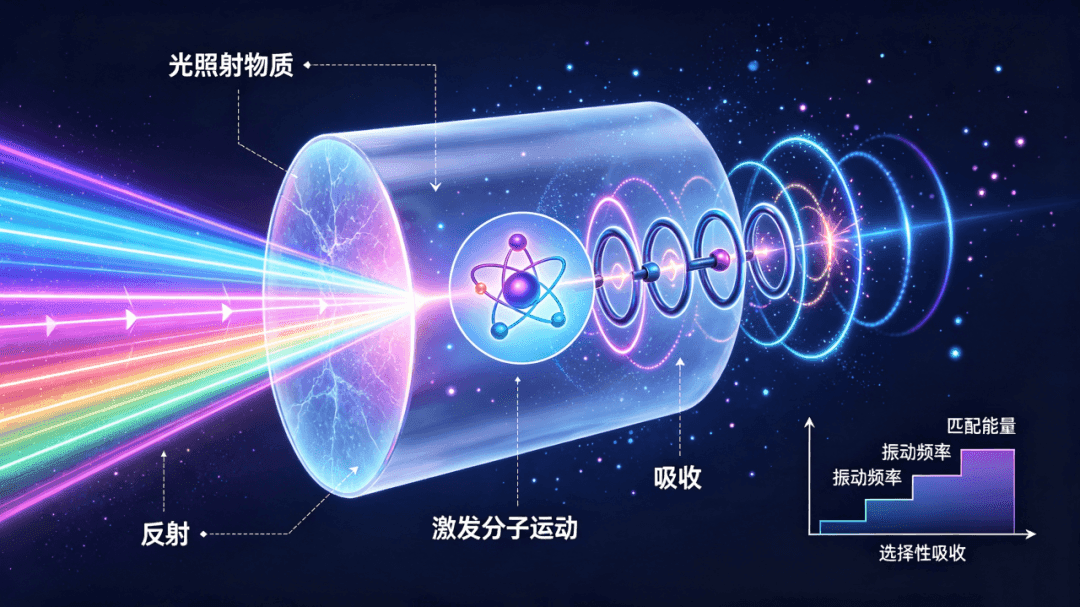
Molecules are not static. The atoms that make up a molecule are connected by chemical bonds, which vibrate continuously like springs. Different chemical bonds (such as O-H, C-H, and N-H) vibrate at different frequencies and require different amounts of energy.
Light is essentially a form of energy. Different wavelengths carry different amounts of energy: shorter wavelengths have higher energy, while longer wavelengths have lower energy.
When the energy of light at a certain wavelength exactly matches the energy required for a particular chemical bond vibration, that light is "selectively absorbed"—used to excite the vibration of that bond. As a result, an "absorption valley" appears at that wavelength on the reflectance spectrum curve.
Behind every absorption valley lies a chemical bond in "resonance."
This is the physical basis for using hyperspectral imaging to detect chemical composition:
The O-H bonds in water molecules have strong absorption peaks near 970 nm, 1450 nm, and 1940 nm—which is why hyperspectral sensing can measure water content.
The C-H and O-H combination vibrations of sugars and starch produce characteristic absorption near 1200 nm, 1500 nm, and 2100 nm—so hyperspectral imaging can measure sugar and starch content.
Protein N-H and C=O bonds have unique absorption patterns in the 1500–2200 nm range—which is why hyperspectral imaging can measure protein content.
Pigment molecules such as chlorophyll and anthocyanins exhibit electronic transition absorption in the visible range (400–700 nm)—so hyperspectral imaging can determine crop maturity and whether disease is present.
Once you understand this, you understand the essence of hyperspectral imaging: it does not "see" molecules directly. Instead, it measures reflectance across hundreds of spectral bands to capture the characteristic light-absorption patterns of different chemical bonds, then translates those patterns into chemical composition and content.
03 What substance does each wavelength band correspond to?
To make this more intuitive, we'll break the commonly used spectral range into bands and see what each interval can actually 'see.'
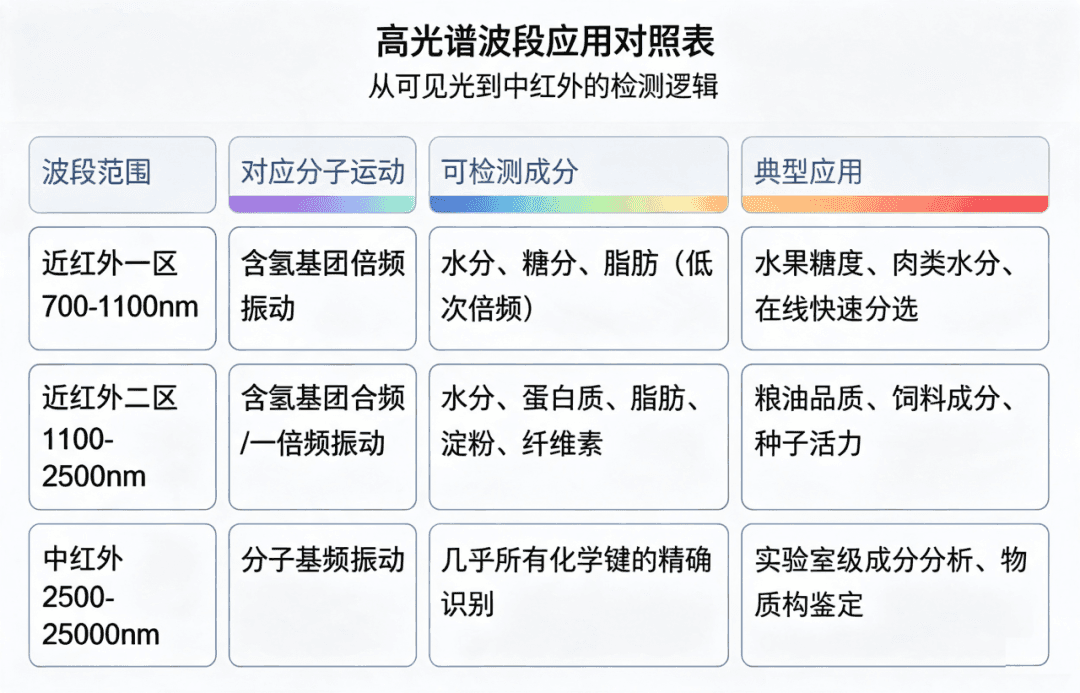
There is an important engineering trade-off here: near-infrared signals are not as strong as mid-infrared signals, but near-infrared can use standard silicon-based or InGaAs detectors, which are low-cost and fast, making it suitable for industrial inline inspection; mid-infrared offers higher precision, but the equipment is expensive and scanning is slow, so it is used more in laboratories.
The most widely used hyperspectral systems in agriculture and the food industry today operate in the visible-to-near-infrared range (400-1000nm). This range can detect pigments as well as mold spoilage, fat, and other components, while equipment costs remain manageable and scanning speed meets production line requirements.
Different wavelength bands reveal different layers of matter's "identity information".
04 From spectral curves to component content
Now that we understand the principle, the next, more practical question is: given a spectral curve, how exactly do we calculate values such as moisture content and sugar content?
This is not a simple matter of looking things up in a comparison table — it is a complete chemometric modeling workflow. It has four steps:
1. Collect spectral data
A hyperspectral camera scans the sample to capture a complete spectral curve for each pixel. At this step, carefully control the lighting conditions, sample temperature, and scan distance, because these factors all affect the absolute reflectance values.
White calibration is also required: normalize the raw data using a standard white reference panel (reflectance close to 100%) to eliminate the effects of uneven illumination and detector dark noise.
2. Spectral preprocessing
Raw spectral data contains a lot of "noise": scattering differences caused by uneven sample surfaces, instrument noise, baseline drift, and more. Building a model directly on raw data will produce poor accuracy.
Common preprocessing methods include:
Multiplicative scatter correction: eliminates the effects of particle size and surface scattering.
Standard normal variate transformation: removes optical path length differences.
First- and second-order derivatives: remove baseline drift and separate overlapping absorption peaks.
Smoothing: remove random noise.
Preprocessing has only one goal: bring out the signal in the spectral data that truly reflects chemical composition, and suppress the irrelevant interference.
3. Build a prediction model
This is the most critical step—and the one that depends most on experience.
You first need to prepare a batch of labeled samples: for example, 100 peanut kernels. Scan them once with hyperspectral imaging, then use chemometric algorithms to find the mathematical relationship between the "spectral features" and the "actual component values."
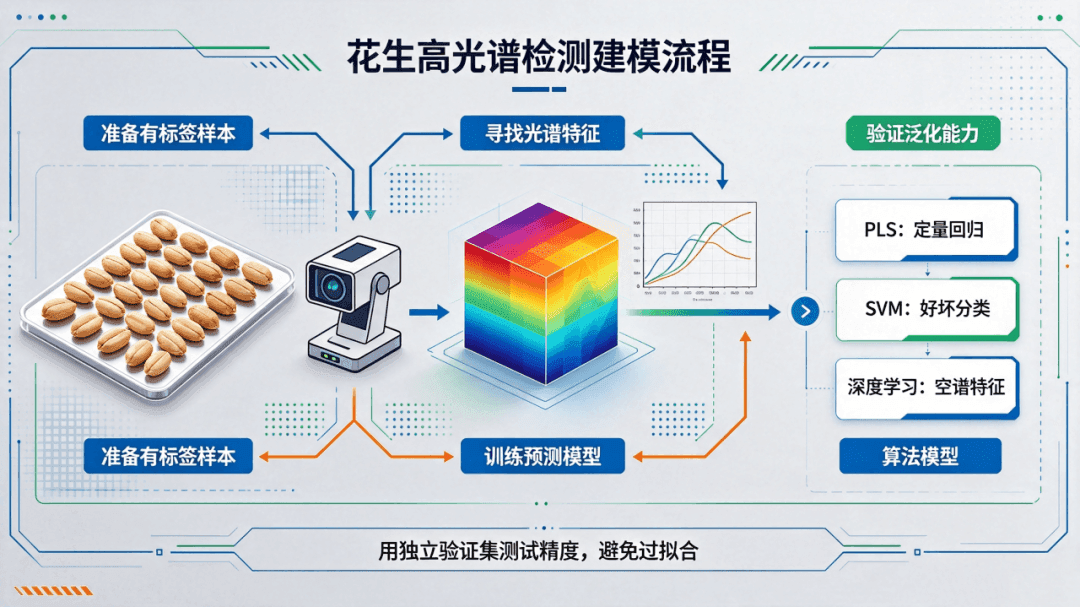
Common algorithms include:
PLS (partial least squares regression): the most classic and widely used quantitative modeling method, suitable for high-dimensional, small-sample data.
SVM (support vector machine): suitable for classification tasks, such as distinguishing good fruit from bad fruit.
Deep learning (CNNs, Transformers, etc.): it has become increasingly popular in recent years, can automatically extract joint spatial–spectral features, and is suited to complex scenarios and large data volumes.
After building the model, test its accuracy on an independent validation set to make sure it has not overfit—that is, it has not simply memorized the training samples but has actually learned the relationship between spectra and composition.
04 forecast sample, same type
Once the model passes validation, it can be put into use. To test similar samples later, you only need to scan them with a hyperspectral sensor and feed the data into the model; the degree of mold contamination can be measured in seconds.
And because it integrates images and spectra, you can not only determine the average composition of the entire sample but also see how that composition is distributed in space—for example, which part of a nut has started to mold, or which part of an apple has the highest sugar content. Traditional chemical testing cannot do this.
Between a beam of light and a numerical value lies an entire rigorous modeling methodology.
05 From the lab to the industrial production line
We’ve covered the principles, but they may still feel a little abstract. Let’s look at real-world application scenarios that have already been implemented.
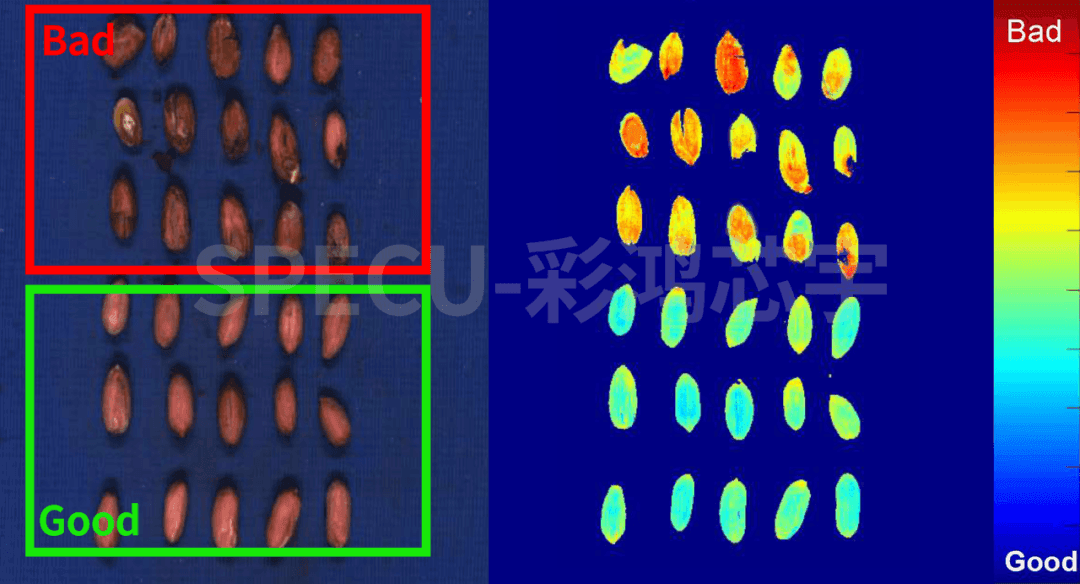
SPECU hyperspectral camera for mold detection in red-skinned peanut kernels
Peanuts are an important oilseed and cash crop in China, but they are highly prone to mold during storage and processing if moisture levels are too high or temperature and humidity are poorly controlled.
To meet the need for mold detection in red-skinned peanut kernels, SPECU developed an inline inspection solution based on a 400–2000 nm visible-to-near-infrared hyperspectral imaging system. The choice of this spectral range was based on clear engineering considerations:
400–700 nm visible region: The seed coat of red-skinned peanut kernels is rich in proanthocyanidins and other phenolic pigments. Once mold develops, mold metabolites and pigment breakdown cause characteristic changes in the visible-region reflectance curve. The spectral difference between normal and moldy peanut kernels is most pronounced in the red-orange 550–680 nm range.
700–1000 nm first near-infrared region: This range contains the second overtone absorption peak of the O–H bond in water molecules (around 970 nm) and the third overtone absorption peak of the C–H bond in fats (around 930 nm). Moldy peanuts often have increased moisture and fat oxidation, which produce quantifiable changes in absorption depth at these two bands.
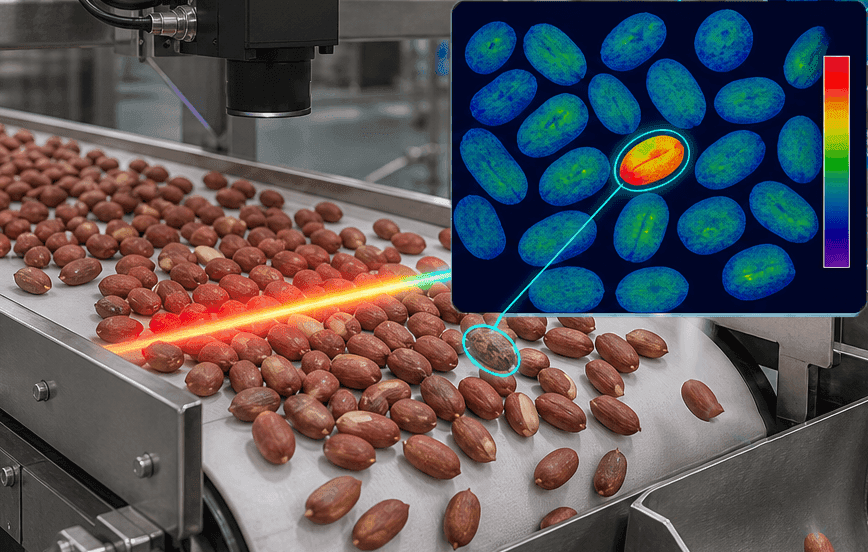
In an actual inspection workflow using a tracked hyperspectral system, red-skinned peanut kernels pass at a constant speed on a conveyor belt through the hyperspectral camera, while the system simultaneously acquires continuous spectra for each pixel in the 400–1000 nm, 1330–1500 nm, and 1550–1700 nm ranges. By training on spectral data from normal peanut kernels and kernels with varying degrees of mold, the following characteristic bands are extracted:
560 nm and 650 nm: reflect changes in seed coat pigments and identify early mold.
930 nm: reflects the extent of fat oxidation and indicates mold progression.
970 nm: reflects changes in moisture content and helps identify mold.
By combining joint spatial-spectral features, the model can make a judgment the instant a peanut passes the camera and drive an air valve to precisely remove moldy kernels. This solution enables non-destructive, rapid, inline full inspection for mold in red-skinned peanut kernels, effectively filling the technical gap between manual sorting and laboratory testing.
06 Common hyperspectral misconceptions
Myth 1: Can you just buy a hyperspectral camera and use it right away?
A hyperspectral camera is just "hardware"; what really determines detection accuracy is the model. Models must be built and calibrated separately for each sample type, detection metric, and operating environment.
In other words, a sugar-content model that Company A built using apples cannot be directly used to measure Company B's apples—because the variety, origin, ripeness, and measurement conditions all differ, so the model must be recalibrated or transferred. This is also the most demanding part of deploying hyperspectral technology in practice.
Myth 2: Is hyperspectral accuracy necessarily higher than chemical methods?
Hyperspectral sensing is an indirect measurement method, and its accuracy ceiling depends on the quality of the calibration model. In most applications, hyperspectral prediction accuracy can reach 90%-95% of traditional chemical methods, which is sufficient for industrial sorting and quality grading.
But for laboratory-grade precision analysis (for example, requiring an error below 0.1%), traditional chemical methods remain the gold standard. The advantage of hyperspectral imaging is not absolute accuracy, but speed, non-destructive operation, imaging capability, and online use.
Myth 3: The more bands, the better?
More bands mean more information, but also more data, slower processing, and higher equipment costs. Adjacent bands are also often highly correlated, creating substantial redundancy.
In practical industrial applications, feature band selection is often used to pick the dozen or so most critical bands from hundreds of bands to achieve the required detection performance. This is also an important path for moving hyperspectral technology from the laboratory to industrial production lines.
Hyperspectral imaging is not some magical "x-ray vision" but a rigorous technology built on molecular vibrational spectroscopy. Different chemical bonds absorb characteristically at specific wavelengths; a hyperspectral camera records these absorption patterns across hundreds of contiguous narrow bands, then uses chemometric models to "translate" the spectra into chemical components and their concentrations.
The value of this technology is not in how "high-tech" it is, but in that it is the first to take chemical composition testing from the lab to the production line—from destructive to nondestructive, and from sampling to full inspection.
When every nut and every seed can be composition-tested in seconds, quality control for food and agricultural products is fundamentally rewritten.
Every ray of absorbed light tells a molecular story about the material. Hyperspectral technology translates those stories into language people can understand.